YOLOv5vsYOLOv8
The Battle for Object Detection Supremacy
Authors • Dataset • Model(s) • Results • Inferences • Summary • Task Distribution
Authors
- Jose Manuel Gutierrez Castellanos
- Eslam Shaarawy
This work provides an overview and introduction of two main models used for object detection applications, showing outstanding results in performance and accuracy.
The YOLOv5 & YOLOv8 models underwent a rigorous series of experiments, encompassing architectural variations, augmentation levels, and the incorporation of negative images. Subsequently, a concise analysis of the inferences drawn from another publicly available dataset is presented and summarized. This experimental investigation is anticipated to contribute to an enhanced comprehension of the applied model designs, offering valuable insights for researchers interested in implementing cutting-edge solutions utilizing the YOLO family models.
Dataset
The dataset used in our experiments is NWPU VHR-10 Dataset. NWPU VHR-10 dataset comprises 10 distinct categories as observed in Figure 1, comprising airplane, baseball diamond, basketball court, bridge, harbor, ground track field, ship, storage tank, tennis court, and vehicle. and is enriched with 650 meticulously annotated images.
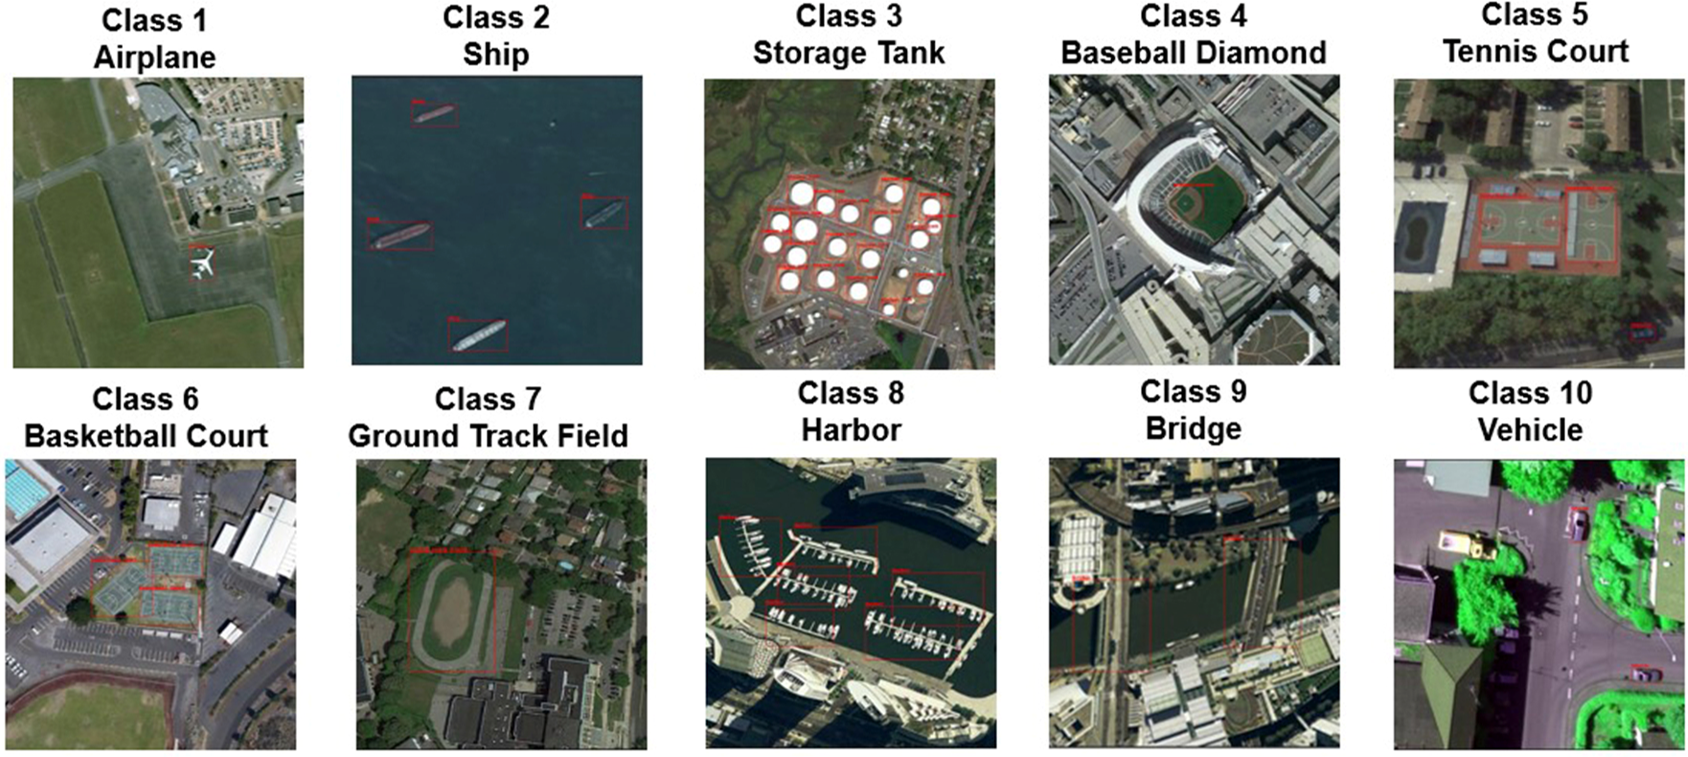
Figure 1. Object examples as per category
This dataset boasts a total of 715 RGB images, sourced from Google Earth, with spatial resolutions spanning from 0.5m to 2m. Additionally, it incorporates 85 pan-sharpened color infrared images, characterized by a spatial resolution of 0.08m, procured from the Vaihingen dataset (Cramer, 2010).
Model(s)
The models used during this research are the following:
YOLOv5 Nano & X
Model details
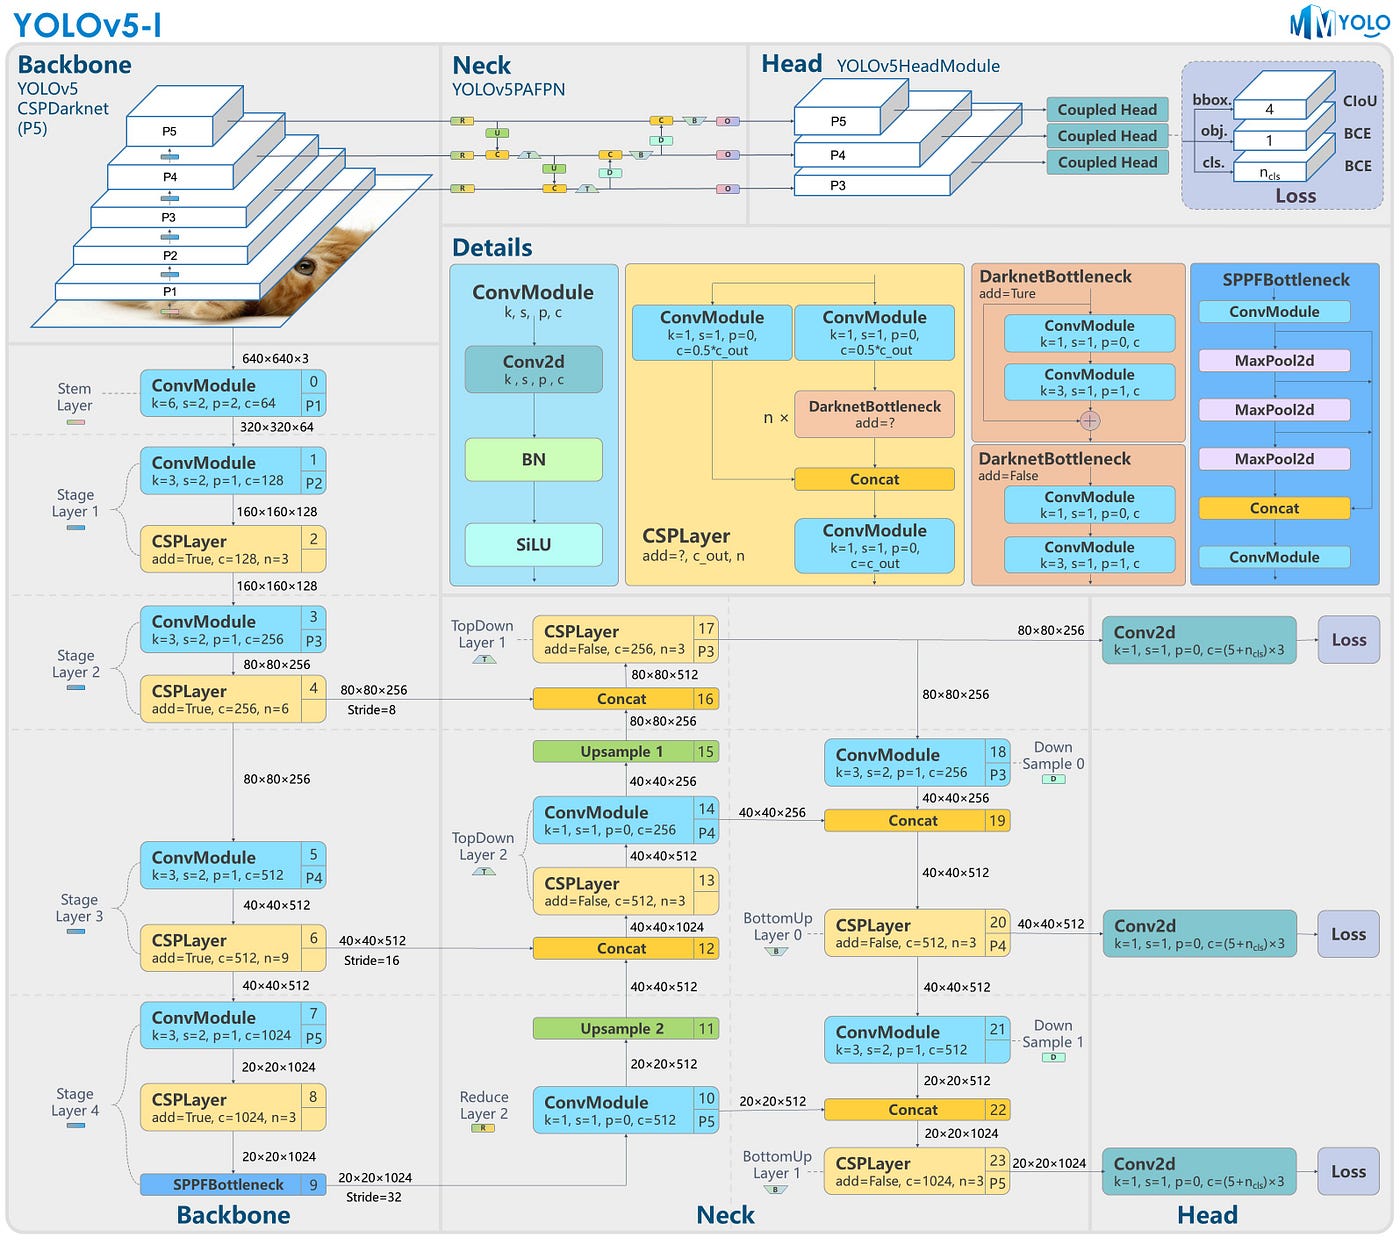
Figure 2. YOLOv5 architecture (RangeKing 2023)
YOLOv8 Nano & X
Model details
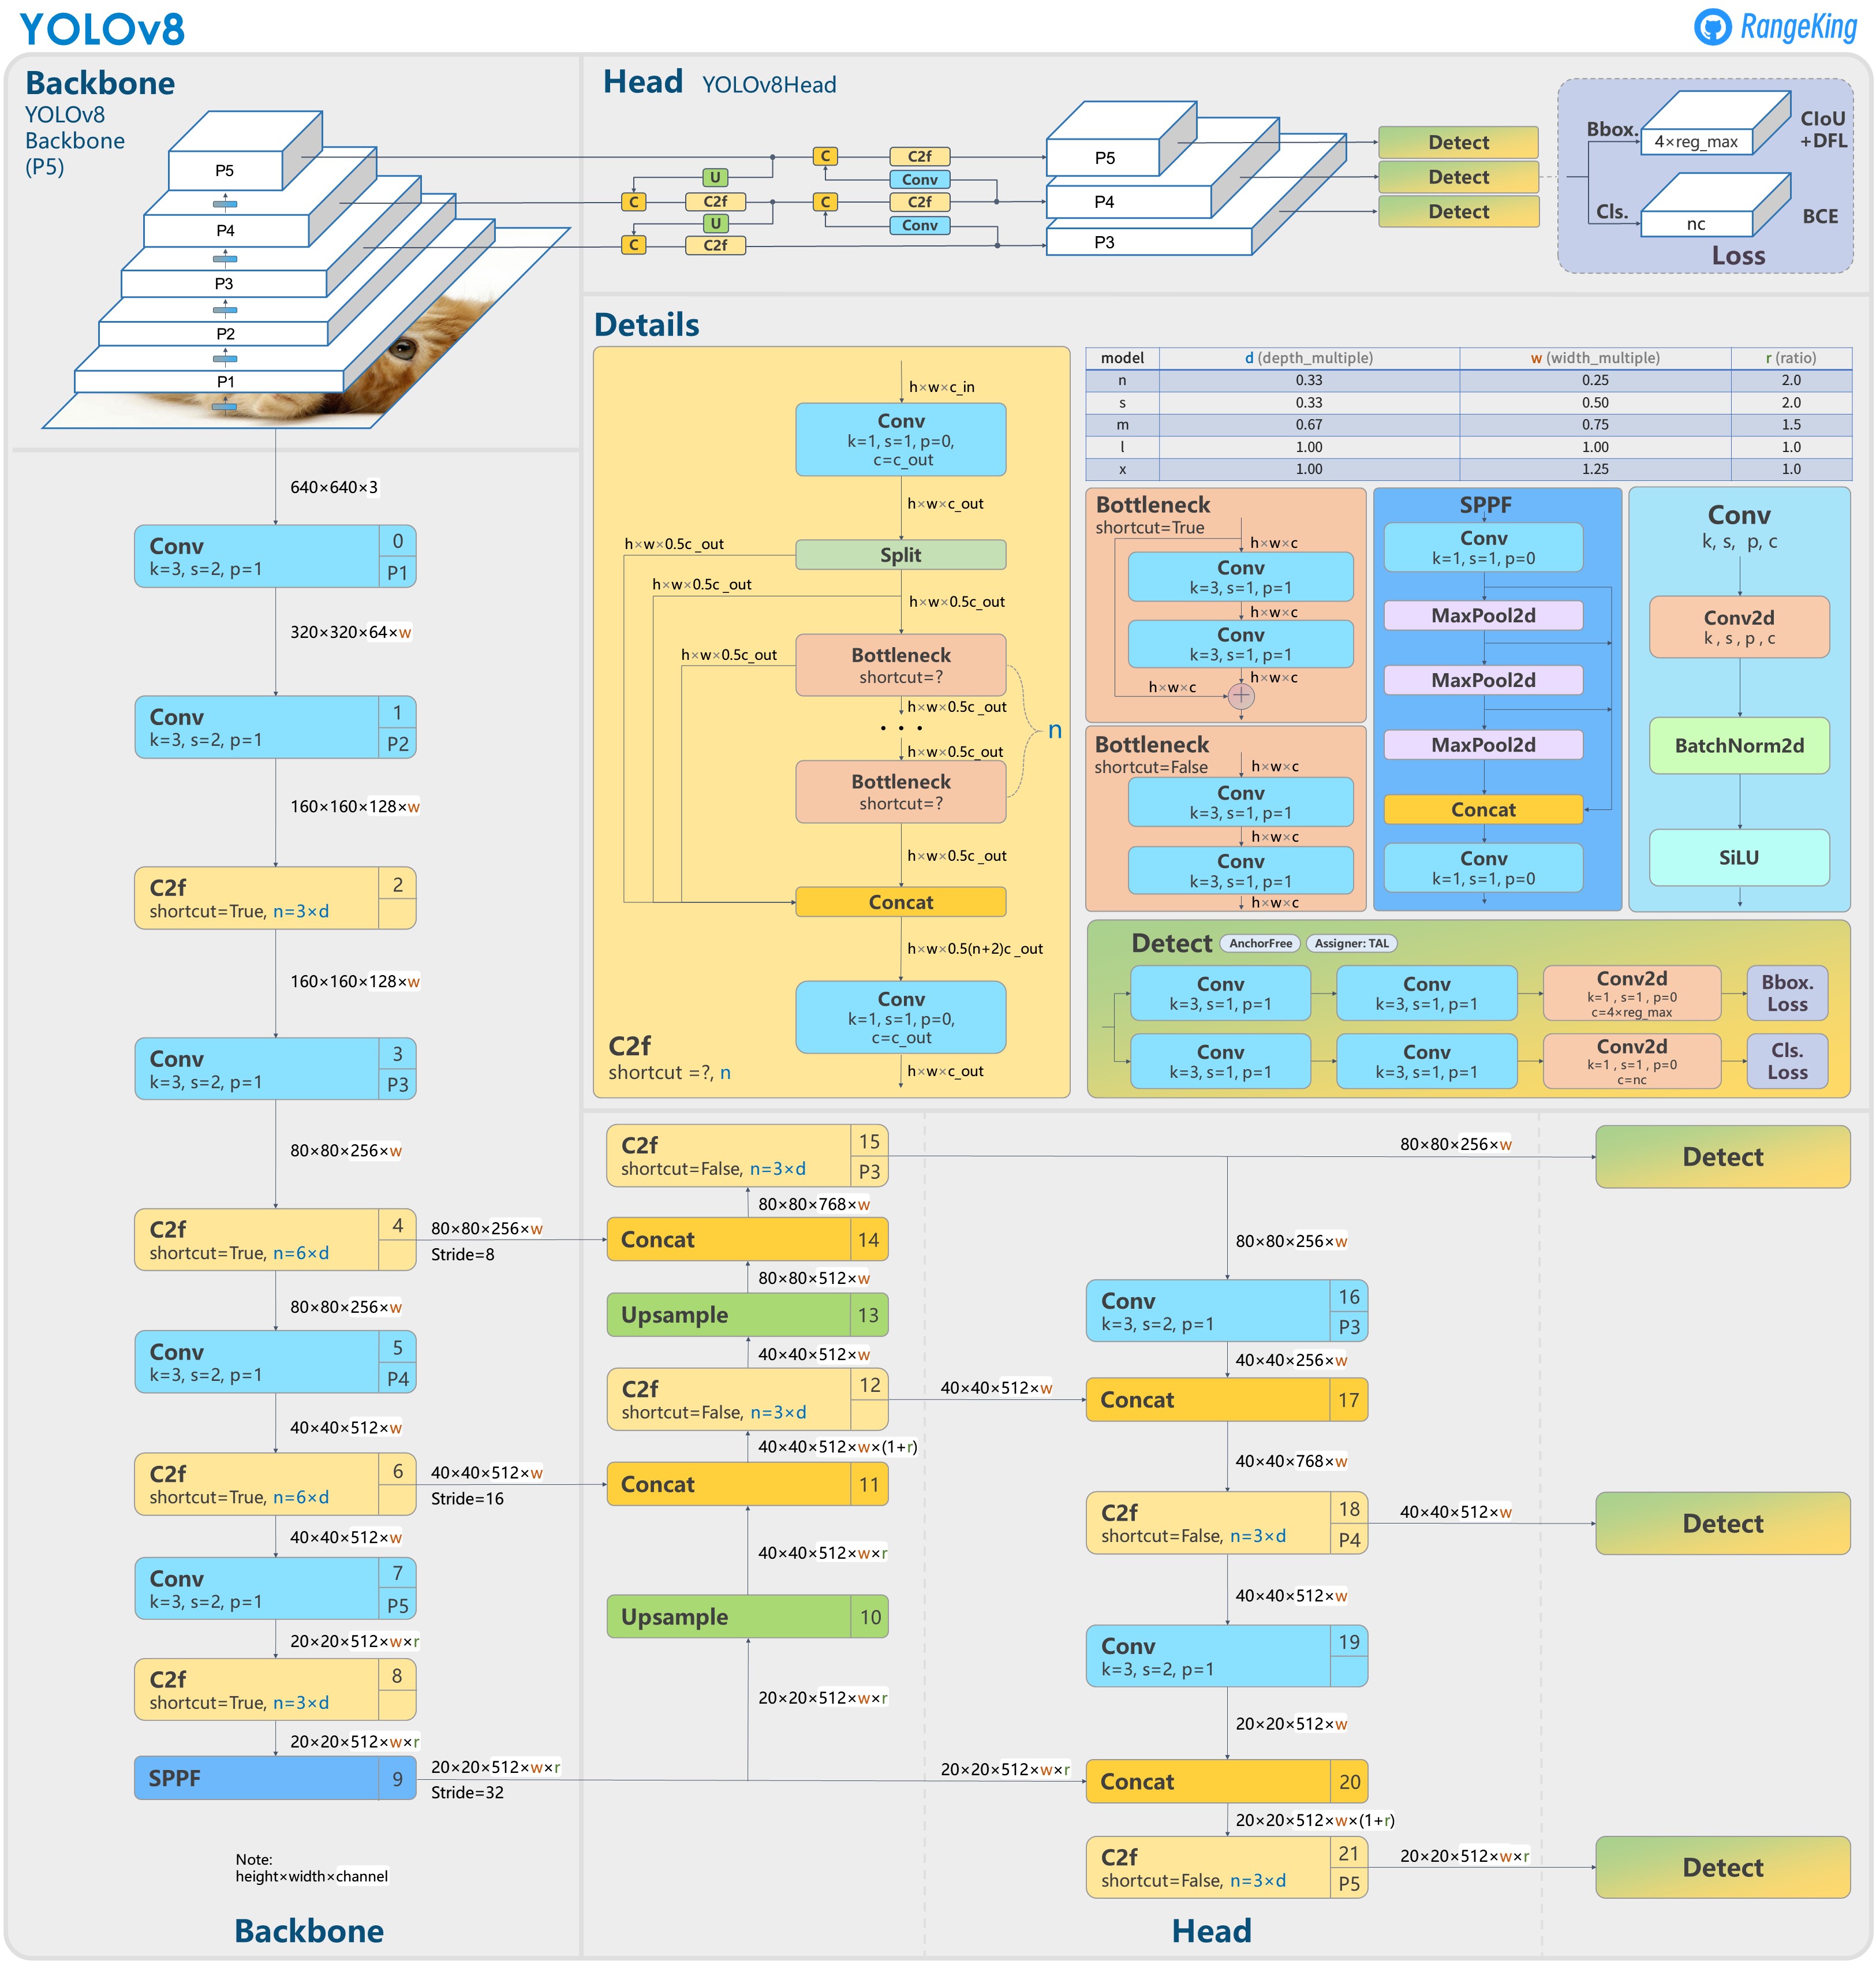
Figure 3. YOLOv8 architecture (RangeKing 2023)
Results
The optimizer used during the experiments is “SGD”, number of epochs defined for training is 50, batch size is set to 10 and the image size is set to the default one, which corresponds to 640
As illustrated in Figure 4, regarding the metrics and losses related to YOLOv5, it is evident that the classification loss curve displays minimal fluctuations, indicating satisfactory performance. However, the objectness loss and bounding box loss exhibit some degree of variability, suggesting room for improvement. This observation implies that the model could benefit from extended training epochs to facilitate convergence.
As evident from the metrics depicted in Figure 5 for YOLOv8, the situation parallels that of YOLOv5, with a the architectural difference. The distributional focal loss and bounding box loss exhibit areas of potential improvement. It is noteworthy that all experiments were conducted with an equivalent number of epochs; however, it is observed that experiments employing model X required extended training times due to the substantial difference in parameters.
As anticipated, YOLOv8, as the latest iteration within the YOLO family, demonstrates noteworthy advancements when compared to its predecessor, YOLOv5.
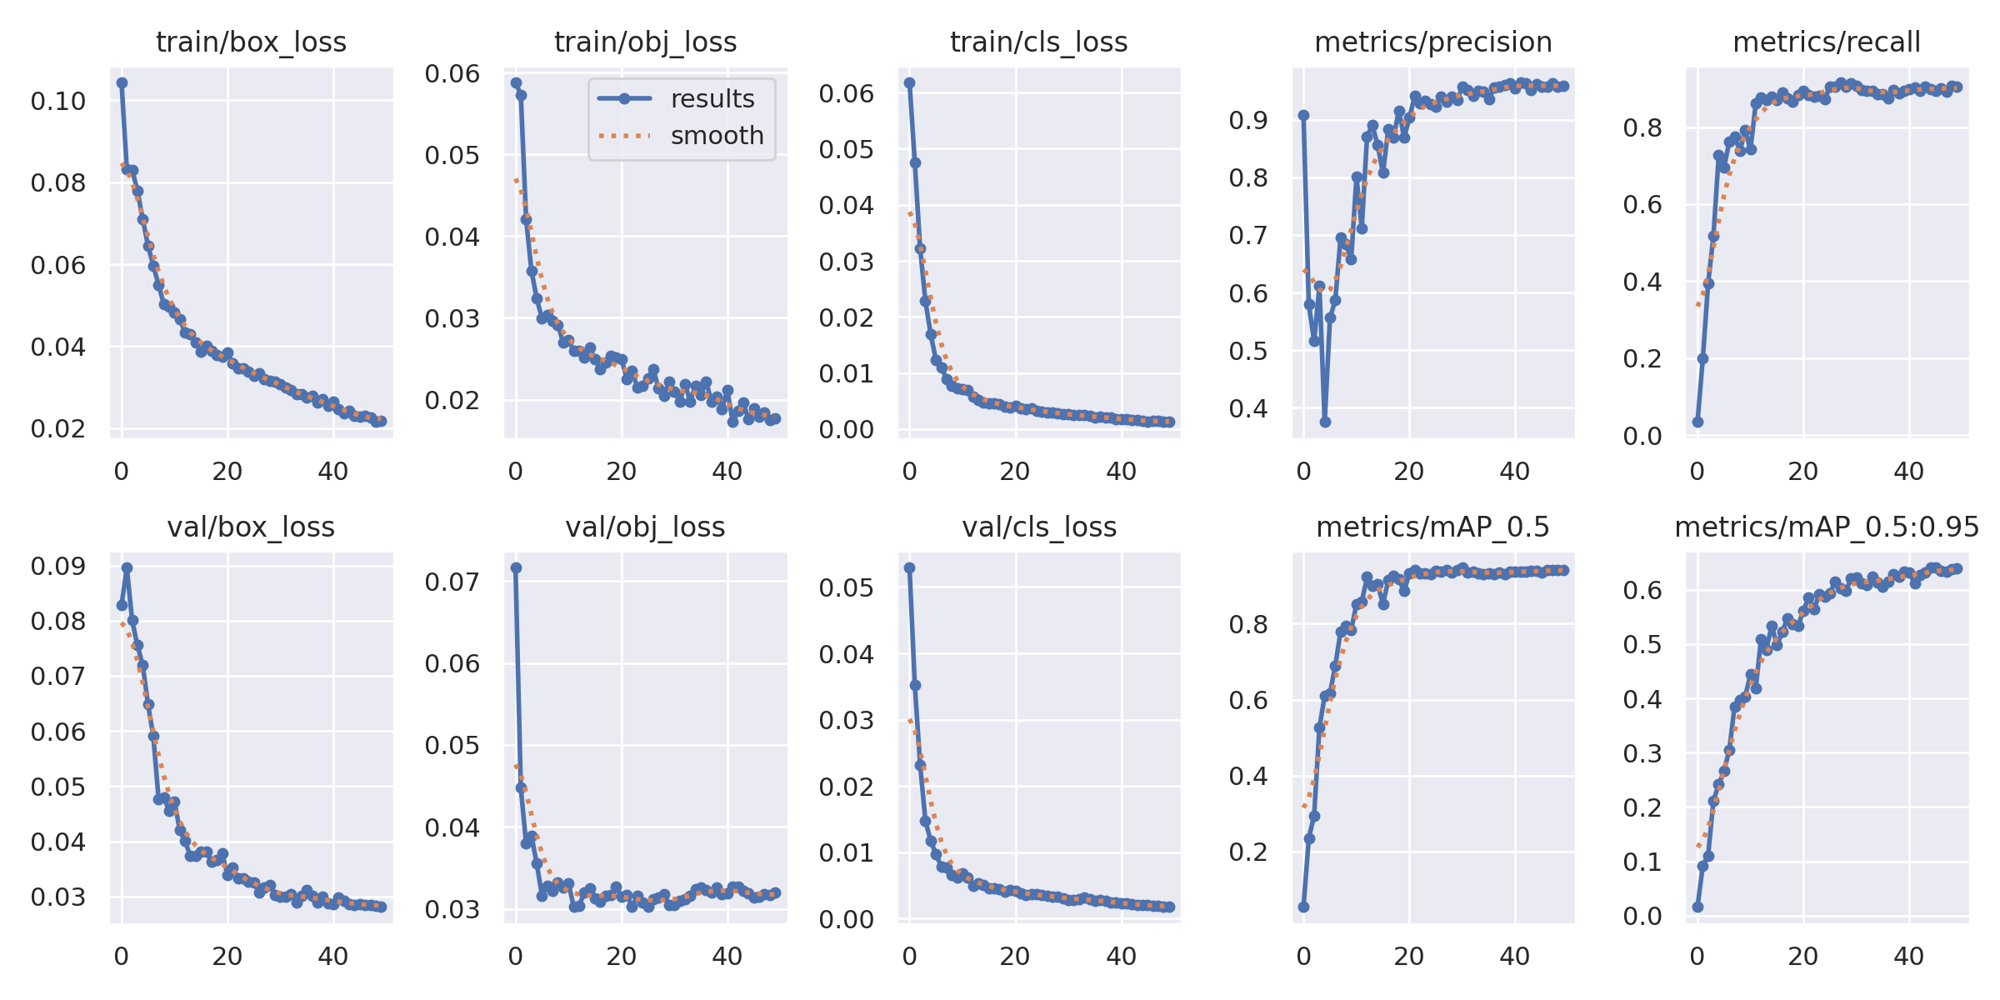
Figure 4. YOLOv5 metrics and losses
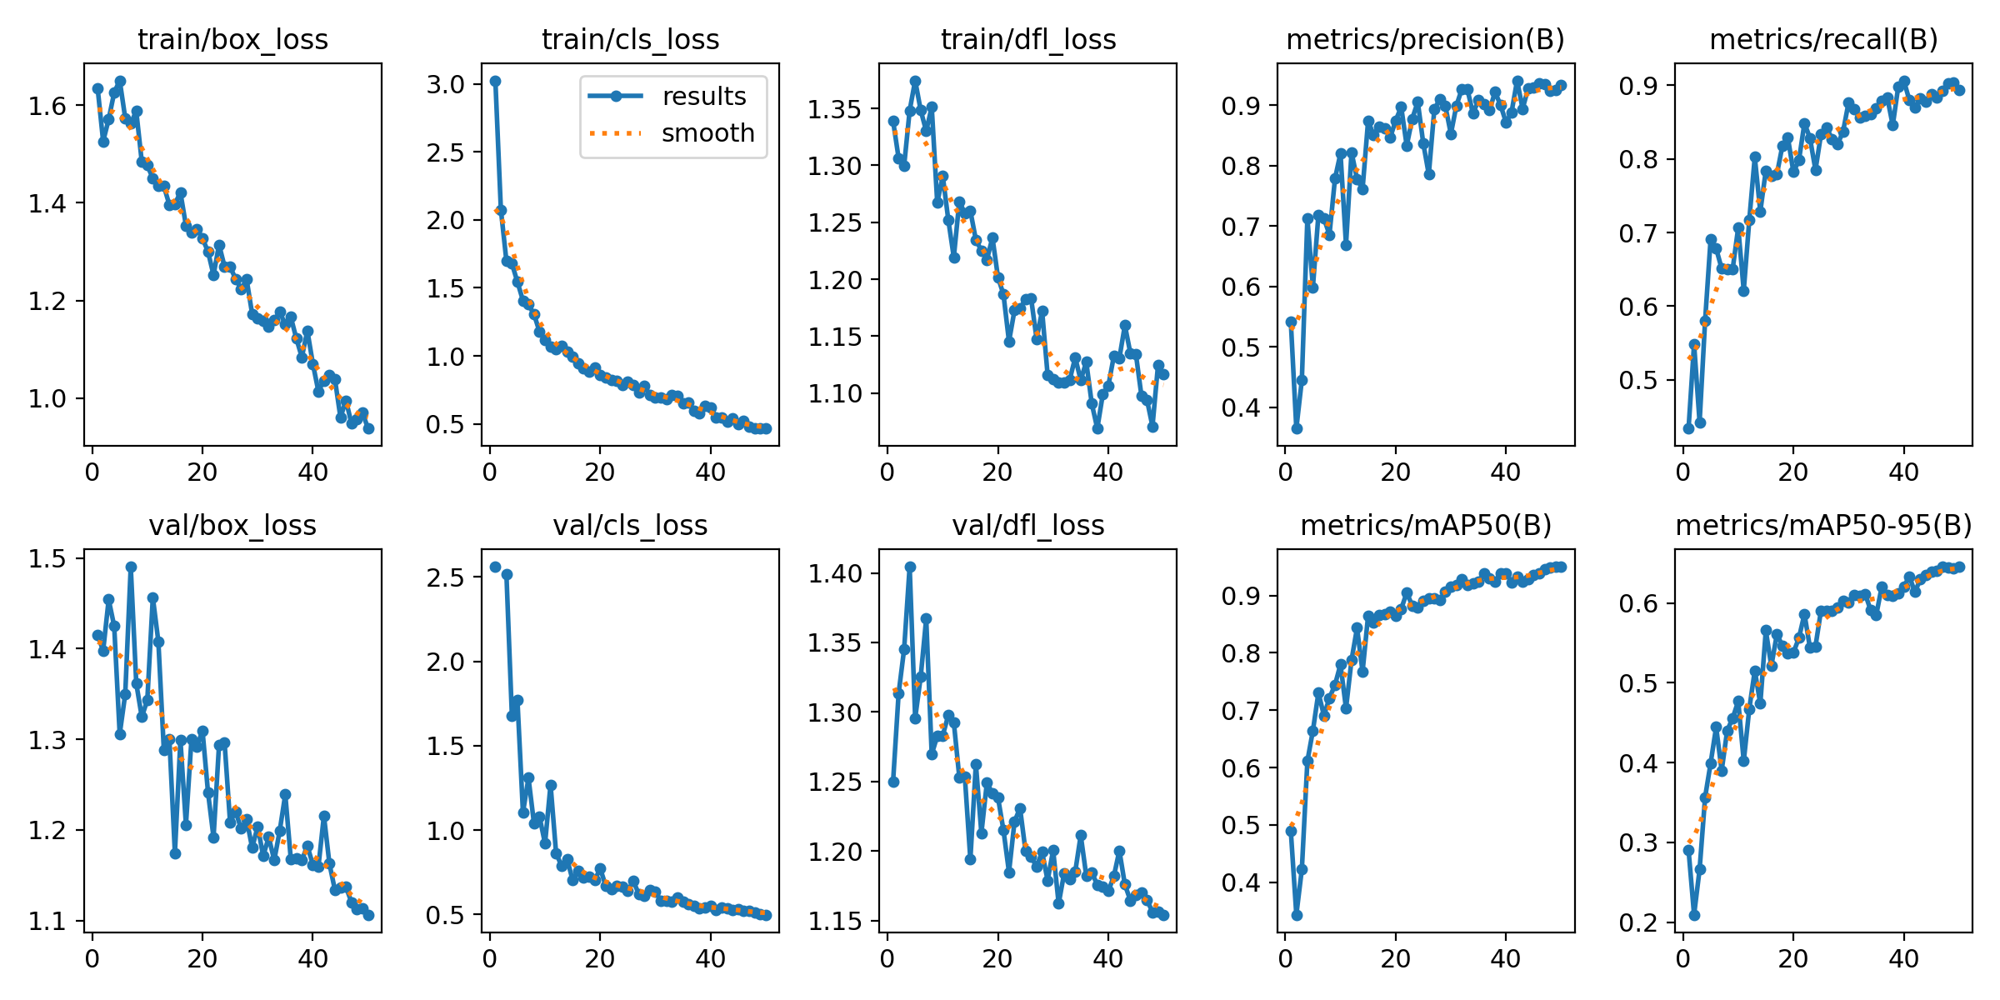
Figure 5. YOLOv8 metrics and losses
To facilitate a more detailed tracking of the experiments conducted in this research paper, we have made our COMET workspace publicly accessible. Researchers are encouraged to utilize this resource to gain insights from our discoveries. Kindly scan the QR code to access it or follow the respective link YOLOv5 - YOLOv8
Inferences

Figure 6. Inference performed with the trained model X of YOLOv8 on NWPU VHR-10
As depicted in Figure 6, the YOLOv8 model X, trained with the High augmentation configuration and incorporating the negative image set during training, demonstrates remarkable accuracy in object classification and precise localization of bounding boxes within the images.
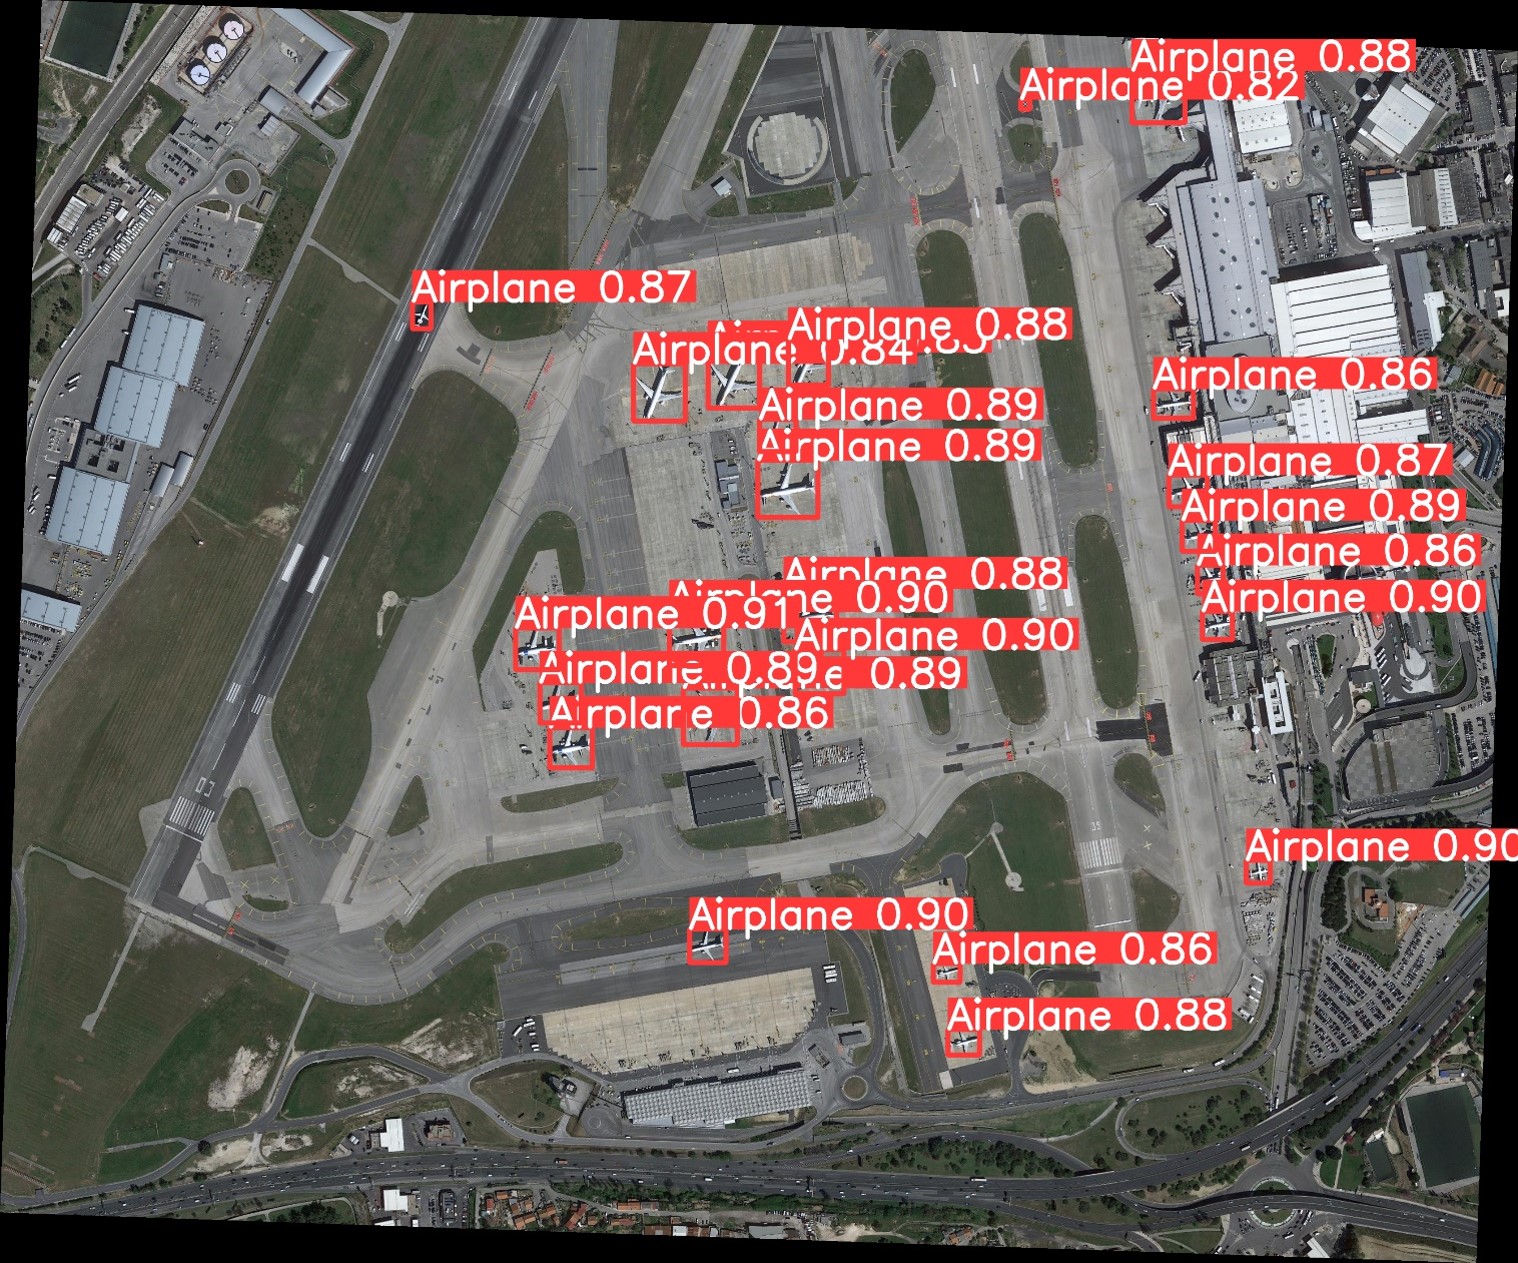
Figure 7. Inference performed with the trained model X of YOLOv8 on DOTA
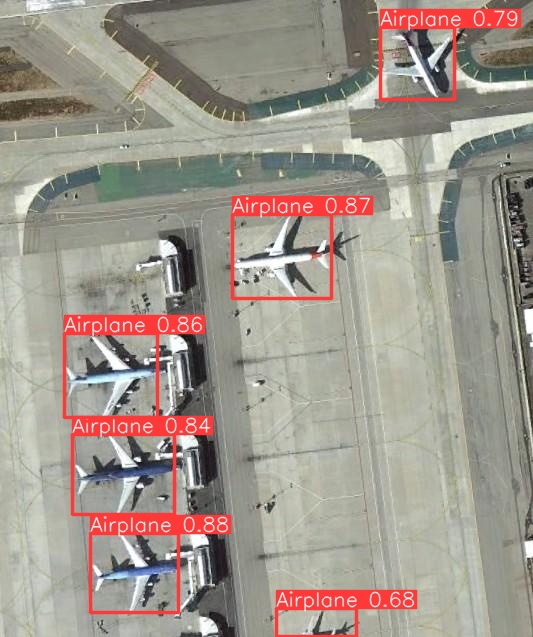
Despite YOLOv8 being trained on the relatively small and low-resolution NWPU VHR-10 dataset, as compared to the larger and higher-resolution DOTA or DIOR datasets, the model’s inferences on DOTA dataset yielded impressive results. Notably, the model exhibited exceptional confidence in detecting airplanes, as illustrated in Figure 7, where even a small airplane positioned in the upper-left corner of the image was detected with a remarkable confidence score of 0.87. It’s important to highlight that these inferences were conducted using non-standard image sizes, as we were dealing with higher-resolution images containing smaller objects compared to those used for YOLOv8 training. In Figure 7, the image size for inference was adjusted to 2632, yielding a confidence score of 0.80